


R tip: Create maps in R
InfoWorld | Jul 20, 2018
In this seventh episode of Do More with R, learn how to create maps in R—it’s easier than you think, thanks to new and updated packages like sf, tmap, and ggplot2
Copyright © 2018 IDG Communications, Inc.
Similar
Hi, I’m Sharon Machlis, Director of Editorial Data & Analytics at IDG Communications. I’m here with episode 7 of Do More With R: Maps.
Not too long ago, analyzing geo-spatial data in R was pretty cumbersome. But that’s changed. The sf package implemented a standard called simple features for R. And now, packages like ggplot2, tmap, and leaflet support sf. As someone tweeted to me the other day: “sf makes GIS in R a joy!”
Let me show you how.
I’ve got a shapefile of counties in California – that’s a geospatial file with boundary information for each county. And, I have a separate CSV data file of median household income by county. I’d like to map income by county.
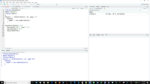
First, I’ll load some packages. Then, I’ll set my options so numbers don’t display as scientific notation.
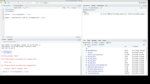
Reading in the CSV file is pretty straightforward. I’ll use readr to import the income data (although you could also use base R’s read.csv).
How to get the shapefile into R? It’s just as easy as reading in a CSV file, if you use the sf package’s st_read function.
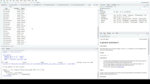
Let’s take a look at this mymap object.
It’s a data frame, and also an sf object. The structure should look pretty familiar – it’s a regular data frame, with geometry tucked into a special geometry column. That makes it pretty easy to work with.
Let me show you what things looked like before simple features.
That’s a large spatial polygons data frame, which is what we typically used for choropleth maps before sf.
Because mymap is basically just a special type of data frame, it’s easy to join mymap with mydata. I can use a regular dplyr inner_join. That returns all rows from the first object where there are matches in the second object, using a common key column.
Now I’ve got my geospatial object with median income for each county.
Time to map!
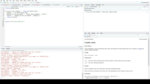
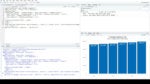
I can create a choropleth map with ggplot2. And it works just like any other kind of ggplot viz.
If you’ve used ggplot2 before, this should look familiar. The first line creates a ggplot2 object using data from the map_and_data dataframe. The next line says what kind of viz this should be – in this case, an sf geom – and the fill color should be based on the Median Income column.
Unfortunatey, in my opinion, ggplot defaults to the darker color mapping to the smaller number. That doesn’t make much sense for income, so I’ll change that using the scale_fill_gradient function, setting the low and high fill colors manually.
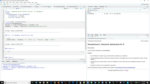
Before wrapping up, I want to show you another package for mapping simple features objects: tmap. I know more people are already familiar with ggplot2, but tmap is my favorite for making maps.
The syntax is similar to ggplot2. The first line creates a tmap object from the map_and_data dataframe. The second line of code says I want to add polygons colored by the MedianIncome column. The identification field for each polygon is the NAME column, which is the county name. And, I decided I’d like a palette of greens instead of the default orange.
And we’ve got a nice static map. But, it gets cooler. Because I can turn that map into an interactive JavaScript map with 2 lines of code.
The first line here sets tmap viewing mode to “view”, which is tmap-speak for interactive. The second line re-draws the map I just made.
I’ll need to open this up in a browser so you can see it
This is a clickable map. You can even change the underlying map layer by default.
And, finally, you can save the static map as a jpg or p-n-g, or save the html map into a stand-alone file, with tmap_save
Pretty neat!
That’s it for this episode, thanks for watching! For more R tips, head to the More With R video page at bit.ly/morewithR. That’s https B I T period L Y slash more with R, all lowercase except for the R. So long, and hope to see you next episode!
Not too long ago, analyzing geo-spatial data in R was pretty cumbersome. But that’s changed. The sf package implemented a standard called simple features for R. And now, packages like ggplot2, tmap, and leaflet support sf. As someone tweeted to me the other day: “sf makes GIS in R a joy!”
Let me show you how.
I’ve got a shapefile of counties in California – that’s a geospatial file with boundary information for each county. And, I have a separate CSV data file of median household income by county. I’d like to map income by county.
First, I’ll load some packages. Then, I’ll set my options so numbers don’t display as scientific notation.
Reading in the CSV file is pretty straightforward. I’ll use readr to import the income data (although you could also use base R’s read.csv).
How to get the shapefile into R? It’s just as easy as reading in a CSV file, if you use the sf package’s st_read function.
Let’s take a look at this mymap object.
It’s a data frame, and also an sf object. The structure should look pretty familiar – it’s a regular data frame, with geometry tucked into a special geometry column. That makes it pretty easy to work with.
Let me show you what things looked like before simple features.
That’s a large spatial polygons data frame, which is what we typically used for choropleth maps before sf.
Because mymap is basically just a special type of data frame, it’s easy to join mymap with mydata. I can use a regular dplyr inner_join. That returns all rows from the first object where there are matches in the second object, using a common key column.
Now I’ve got my geospatial object with median income for each county.
Time to map!
I can create a choropleth map with ggplot2. And it works just like any other kind of ggplot viz.
If you’ve used ggplot2 before, this should look familiar. The first line creates a ggplot2 object using data from the map_and_data dataframe. The next line says what kind of viz this should be – in this case, an sf geom – and the fill color should be based on the Median Income column.
Unfortunatey, in my opinion, ggplot defaults to the darker color mapping to the smaller number. That doesn’t make much sense for income, so I’ll change that using the scale_fill_gradient function, setting the low and high fill colors manually.
Before wrapping up, I want to show you another package for mapping simple features objects: tmap. I know more people are already familiar with ggplot2, but tmap is my favorite for making maps.
The syntax is similar to ggplot2. The first line creates a tmap object from the map_and_data dataframe. The second line of code says I want to add polygons colored by the MedianIncome column. The identification field for each polygon is the NAME column, which is the county name. And, I decided I’d like a palette of greens instead of the default orange.
And we’ve got a nice static map. But, it gets cooler. Because I can turn that map into an interactive JavaScript map with 2 lines of code.
The first line here sets tmap viewing mode to “view”, which is tmap-speak for interactive. The second line re-draws the map I just made.
I’ll need to open this up in a browser so you can see it
This is a clickable map. You can even change the underlying map layer by default.
And, finally, you can save the static map as a jpg or p-n-g, or save the html map into a stand-alone file, with tmap_save
Pretty neat!
That’s it for this episode, thanks for watching! For more R tips, head to the More With R video page at bit.ly/morewithR. That’s https B I T period L Y slash more with R, all lowercase except for the R. So long, and hope to see you next episode!


Popular
Featured videos from IDG.tv