

R tip: R Markdown tutorial
InfoWorld | Sep 10, 2018
In this 10th episode of Do More with R, learn how to create HTML, Word docs, PowerPoint presentations, and more that combine text, graphics, and R code
Copyright © 2018 IDG Communications, Inc.
Similar
Hi, I’m Sharon Machlis, Director of Editorial Data & Analytics at IDG Communications. I’m here with Episode 10 of Do More With R: R Markdown in less than 6 minutes.
Let’s say you’ve done an analysis, but now you want share it. Which means you probably want to add some sort of explanation and context. If you’ve never used R Markdown before, you’re in for a treat.
R Markdown lets you combine text, graphics, and embedded R code into a single document. That R code can just be displayed, but not actually run. The code can also be run, to create a chart or graph or statistical model. If you run the code, you also get to decide whether you want your viewers to just see the results of your code, or your code, too.
You can turn an R Markdown document into an HTML file, a slideshow, a PDF – even, yes, a Microsoft Word doc. Let’s take a look.
In RStudio, if you go to File > New Document, you’ll see an option for R Markdown. Choose that
And see what happens. You’re asked if you want a Document, a Presentation, a Shiny application, or a document from a template – either built-in, or your own. Document offers defaults of HTML, PDF, or Word.
“Presentation” means “Slideshow”. Brand new as of August: RStudio’s preview release supports PowerPoint! I’ll get to that in a bit.
Let’s stick to HTML Document for now. I’ll name this “Test”
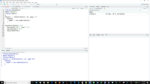
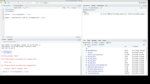
Here’s the default that shows up. That first part is the header, between the sets of 3 dashes. This is in a format called YAML, Y.A.M.L. In addition to the title, author, and date, it sets the output as an html document.
Next, see the area in gray between the sets of 3 backticks? That’s an R code chunk. The first line between the braces says that the language is R – you can run other languages in an R Markdown document, like Python or SQL. Next is the name of the chunk – a name isn’t required, but you can have one. After that comes any chunk options. Include = FALSE means run code in the chunk, but doesn’t include it in the final document. That makes sense for this chunk, since it’s just setting up options for the rest of the file. So we don’t need it in our final output.
That next line is setting an R Markdown option for the whole document. echo =TRUE means display all the code as well as code output in the final document.
Outside of chunks, you can just type normally. 1, 2, or 3 pound signs at the start of a line sets headline size: 2 pound signs are equivalent to an HTML h2 headline size, if you’re familiar with that. 2 asterisks on each side of a word makes it bold.
You can see 2 other R chunks here. One just runs the summary function on the cars data set. The other generates a plot. See that echo = FALSE option in the pressure chunk? It says: Don’t display the code, just the result. If you actually read the text in this default R Markdown document that RStudio generated, it explains a few more things about the file.
To get an HTML document from this, click that Knit button here.
You’ll first need to save the file as a dot RMD.
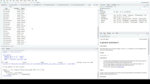
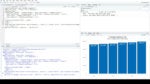
You can see the HTML file, let me open it in a browser window
We can see that the R code is included in that first chunk result, but not in the second, because we said echo = FALSE in that second one.
There’s a lot more you can do with R Markdown.
For example, these little green arrows let you run one individual chunk and see the results. Check out rmarkdown dot rstudio dot com for a lot more about R Markdown.
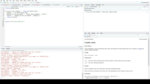
Before I wrap up, I want to show you how to generate a PowerPoint from R Markdown. Reminder: This is new as of August 2018. As of early September, you need the PREVIEW RELEASE of RStudio for this to work. And also the latest version of the rmarkdown package from CRAN. Make sure you have that by running install.packages rmarkdown.
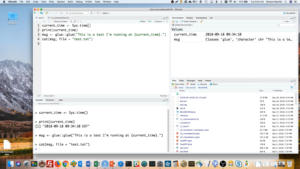
Now let’s create a new R Markdown slideshow document! I’ll go to File > New File > R Markdown, and then choose Presentation and PowerPoint!
I saved the default and knitted it. Seriously, how cool is that?
So let’s look at the default document to see what happened.
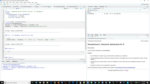
What makes a new slide? Whatever the first headline line is – remember, that’s any line starting with 1 or more pound signs – followed by regular text. That becomes the signal to generate a new slide. Same for adding new slides.
You can add images to an R Markdown document by starting a line with an exclamation point, followed by brackets for the caption and parentheses for the file name. Like I did here with the San Diego photo.
You can use knitr’s kable function to make a table, too.
There is a ton of customization you can do with RMarkdown, like adding your own CSS to HTML documents, and using your own templates for PowerPoint. If you’re interested in doing more with this, do check out RStudio’s RMarkdown resources.
That’s it for this episode, thanks for watching! For more R tips, head to the More With R video page at go.infoworld.com/morewithR. That’s https go dot infoworld dot com slash more with R, all lowercase except for the R. Or, you can add the “Do More With R” playlist to your YouTube library. So long, and hope to see you next episode!
Let’s say you’ve done an analysis, but now you want share it. Which means you probably want to add some sort of explanation and context. If you’ve never used R Markdown before, you’re in for a treat.
R Markdown lets you combine text, graphics, and embedded R code into a single document. That R code can just be displayed, but not actually run. The code can also be run, to create a chart or graph or statistical model. If you run the code, you also get to decide whether you want your viewers to just see the results of your code, or your code, too.
You can turn an R Markdown document into an HTML file, a slideshow, a PDF – even, yes, a Microsoft Word doc. Let’s take a look.
In RStudio, if you go to File > New Document, you’ll see an option for R Markdown. Choose that
And see what happens. You’re asked if you want a Document, a Presentation, a Shiny application, or a document from a template – either built-in, or your own. Document offers defaults of HTML, PDF, or Word.
“Presentation” means “Slideshow”. Brand new as of August: RStudio’s preview release supports PowerPoint! I’ll get to that in a bit.
Let’s stick to HTML Document for now. I’ll name this “Test”
Here’s the default that shows up. That first part is the header, between the sets of 3 dashes. This is in a format called YAML, Y.A.M.L. In addition to the title, author, and date, it sets the output as an html document.
Next, see the area in gray between the sets of 3 backticks? That’s an R code chunk. The first line between the braces says that the language is R – you can run other languages in an R Markdown document, like Python or SQL. Next is the name of the chunk – a name isn’t required, but you can have one. After that comes any chunk options. Include = FALSE means run code in the chunk, but doesn’t include it in the final document. That makes sense for this chunk, since it’s just setting up options for the rest of the file. So we don’t need it in our final output.
That next line is setting an R Markdown option for the whole document. echo =TRUE means display all the code as well as code output in the final document.
Outside of chunks, you can just type normally. 1, 2, or 3 pound signs at the start of a line sets headline size: 2 pound signs are equivalent to an HTML h2 headline size, if you’re familiar with that. 2 asterisks on each side of a word makes it bold.
You can see 2 other R chunks here. One just runs the summary function on the cars data set. The other generates a plot. See that echo = FALSE option in the pressure chunk? It says: Don’t display the code, just the result. If you actually read the text in this default R Markdown document that RStudio generated, it explains a few more things about the file.
To get an HTML document from this, click that Knit button here.
You’ll first need to save the file as a dot RMD.
You can see the HTML file, let me open it in a browser window
We can see that the R code is included in that first chunk result, but not in the second, because we said echo = FALSE in that second one.
There’s a lot more you can do with R Markdown.
For example, these little green arrows let you run one individual chunk and see the results. Check out rmarkdown dot rstudio dot com for a lot more about R Markdown.
Before I wrap up, I want to show you how to generate a PowerPoint from R Markdown. Reminder: This is new as of August 2018. As of early September, you need the PREVIEW RELEASE of RStudio for this to work. And also the latest version of the rmarkdown package from CRAN. Make sure you have that by running install.packages rmarkdown.
Now let’s create a new R Markdown slideshow document! I’ll go to File > New File > R Markdown, and then choose Presentation and PowerPoint!
I saved the default and knitted it. Seriously, how cool is that?
So let’s look at the default document to see what happened.
What makes a new slide? Whatever the first headline line is – remember, that’s any line starting with 1 or more pound signs – followed by regular text. That becomes the signal to generate a new slide. Same for adding new slides.
You can add images to an R Markdown document by starting a line with an exclamation point, followed by brackets for the caption and parentheses for the file name. Like I did here with the San Diego photo.
You can use knitr’s kable function to make a table, too.
There is a ton of customization you can do with RMarkdown, like adding your own CSS to HTML documents, and using your own templates for PowerPoint. If you’re interested in doing more with this, do check out RStudio’s RMarkdown resources.
That’s it for this episode, thanks for watching! For more R tips, head to the More With R video page at go.infoworld.com/morewithR. That’s https go dot infoworld dot com slash more with R, all lowercase except for the R. Or, you can add the “Do More With R” playlist to your YouTube library. So long, and hope to see you next episode!

Popular
Featured videos from IDG.tv