


Machine learning is fast becoming the go-to predictive paradigm for data scientists and developers alike. Of the many tools available for tapping neural networks, Microsoft’s Azure ML Studio offers a quick learning curve that won’t take deep data or coding chops to get up and running.
Microsoft Azure Machine Learning Studio is a cloud service for performing value prediction (regression), anomaly detection, structure discovery (clustering), and category prediction (classification). While my previous tutorial for TensorFlow revealed how Google’s open source machine learning and deep neural network library requires you to roll up your sleeves a bit before digging in, Azure ML Studio’s graphical, modular approach will have you testing machine learning models quickly, as you will see below.
Let’s get started.
Prerequisites
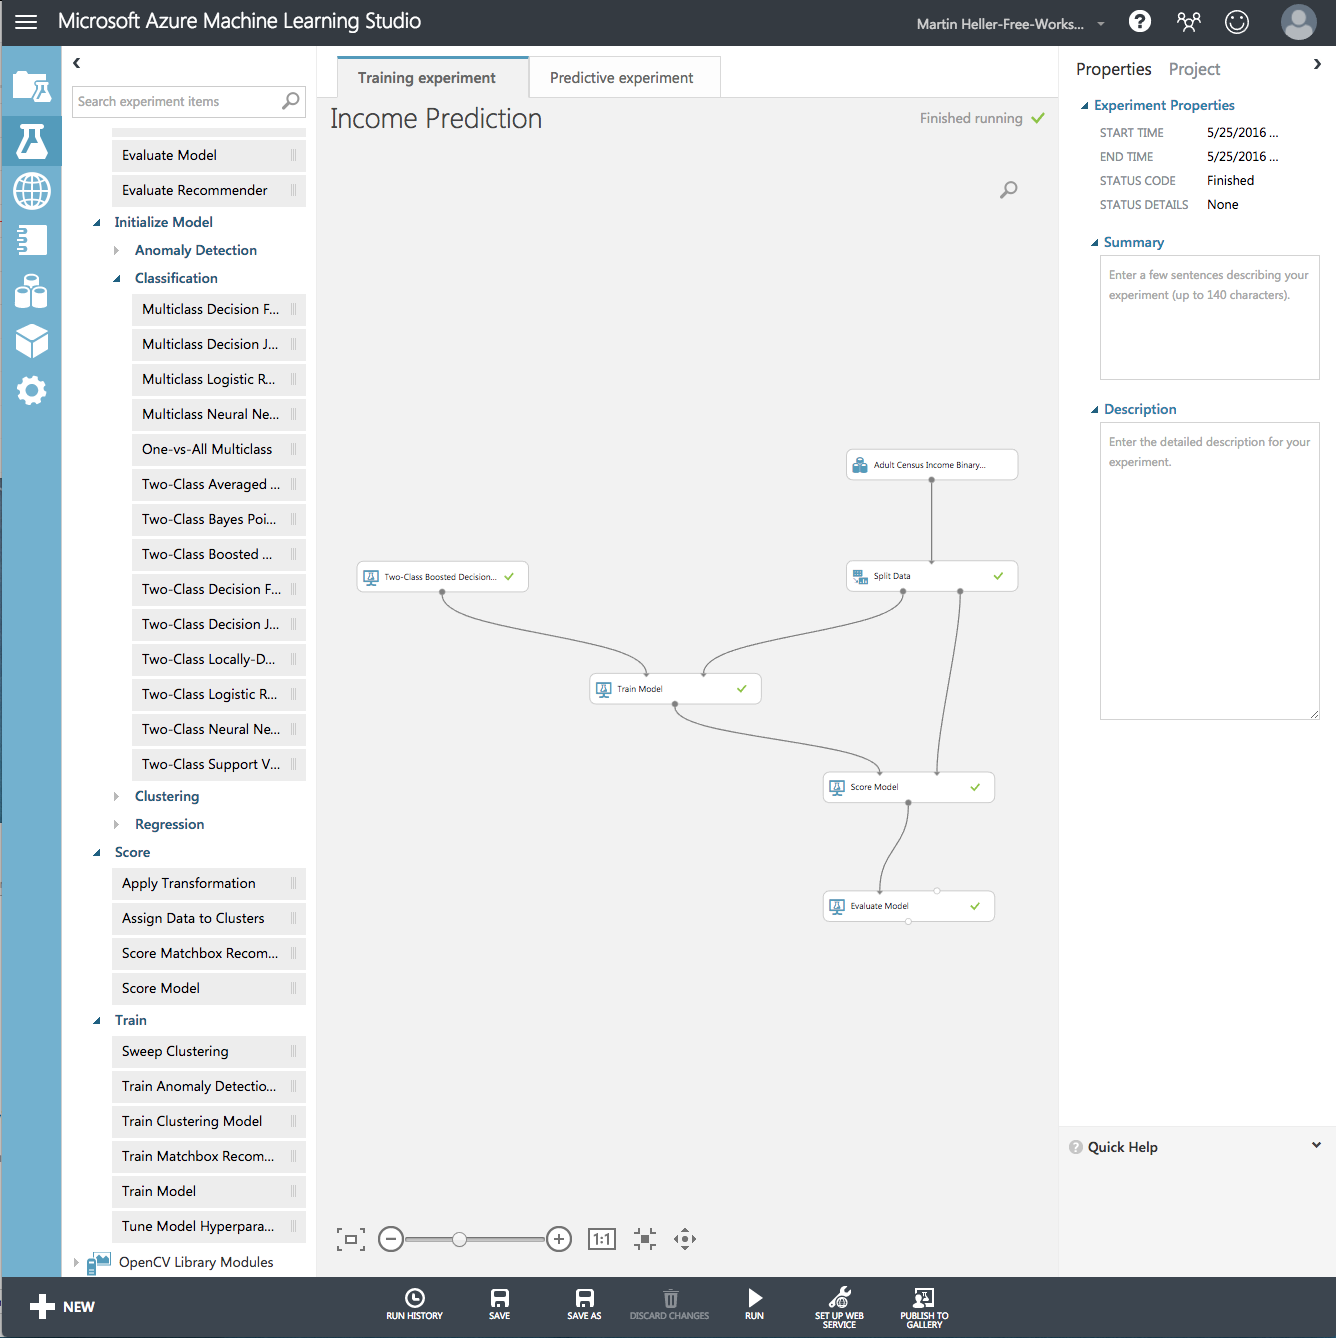
Azure ML Studio takes a modular, drap-and-drop approach to machine learning.
Using Machine Learning Studio can be easier than programming a library such as Google TensorFlow or Microsoft Cognitive Toolkit, thanks to its a drag-and-drop graphical UI for designing and running training and prediction experiments, as shown in the screenshot above. The studio also offers contextual help, but you’re not entirely absolved of development responsibilities: You will need to string together modules in ways that make programmatic sense, and you will on occasion need to write snippets of R or Python to supplement the modules provided.
You will also need to know a little about machine learning in the main ahead of time to keep from being overwhelmed. I covered most of that in my previous tutorial, so you can refer to “Get started with TensorFlow” for an intro to machine learning, neural networks, and deep learning. Pay attention to the “Prerequisites” and “Quick intro” sections of that article; there’s no crying need to go into the discussion of TensorFlow for the purpose at hand, unless you’re curious. Another, simpler introductory resource is Microsoft’s Data Science for Beginners video series.
Create an Azure machine learning workspace
To get started, you’ll need to create an Azure ML Studio workspace. There are two major routes for doing this. One starts at studio.azureml.net as shown below:
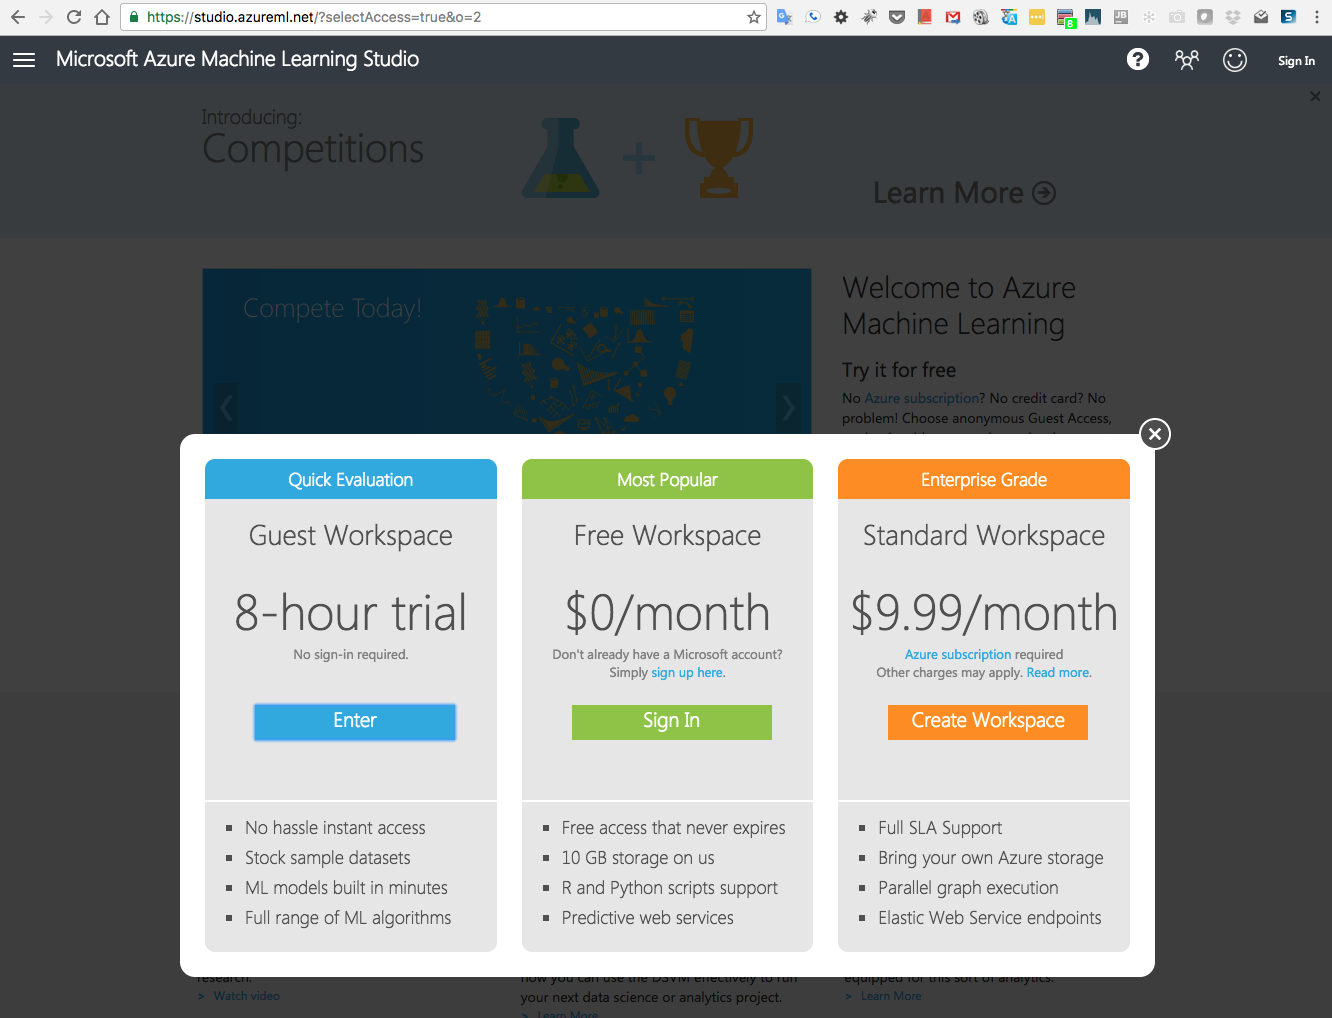
Azure ML Studio offers three tiers of workspaces for you to use.
The first option above (Guest Workspace) doesn’t even require a Microsoft account, but it doesn’t get you far on the road to machine learning. The second (Free Workspace) is also free, but requires a sign-in; it lets you both experiment and set up web services with limited storage and a single node. The third option (Standard Workspace) requires an Azure subscription; it offers more power and an SLA, and it costs $10 a month.
The second major route to creating an Azure ML Studio workspace requires an Azure subscription, and it starts from the Azure portal, as shown below; the various options are for different levels of prediction web services, and all include a workspace. The DEVTEST option is free but limited to 1,000 transactions per month; the S1 through S3 options range from about $97 a month for 100,000 transactions to about $9,700 a month for 50 million transactions.
For the purposes of this tutorial, you should create a free Azure ML workspace and, if you have an Azure subscription, a free DEVTEST Standard workspace.
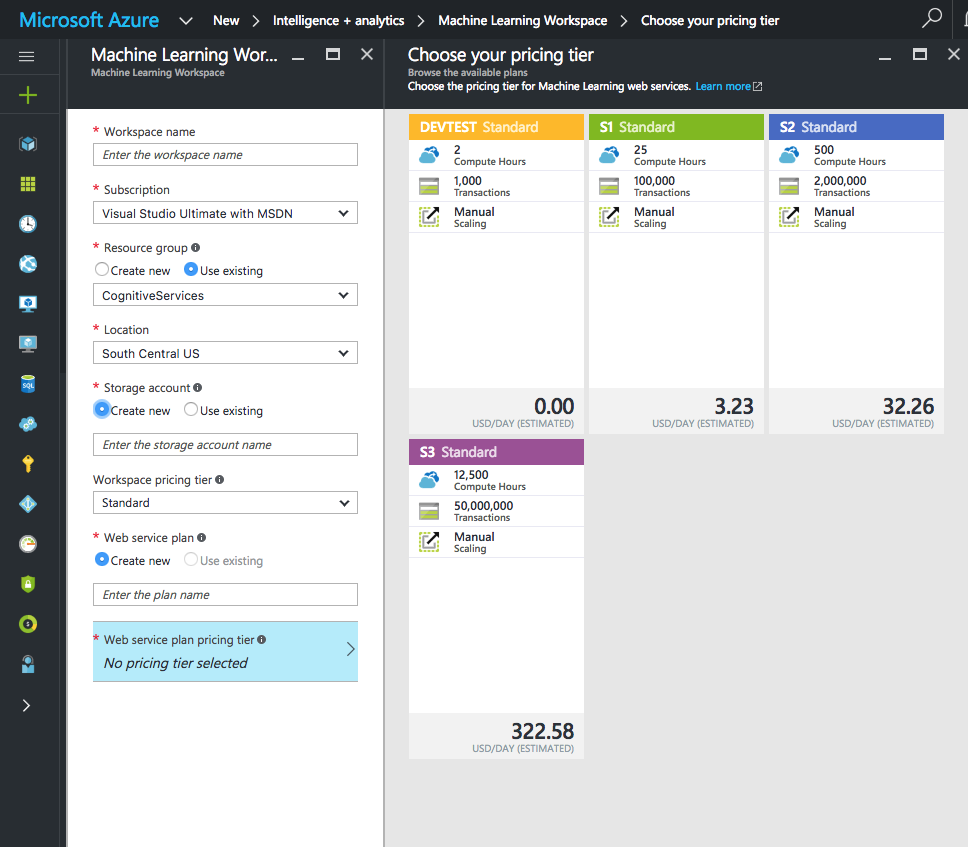
Azure offers four tiers of workspaces for machine learning.
Understand how to use Azure ML
For those of you who skipped the references I gave above (or as review for those who read them), here’s the TL;DR outline of using Azure ML Studio:
- Create a new experiment in ML Studio.
- Start with some data (either canned or from your own data source) and drag the data set to the Training Experiment canvas.
- Look at the data and exclude any columns that have a lot of missing data (Select Columns in Dataset module).
- Exclude any rows that still have missing data in the remaining columns (Clean Missing Data module).
- Look at the data again and pick the columns you want to use for your prediction (another Select Columns in Dataset module). You may want to vary this when you iterate.
- Split the data into a training set and a testing set (Split Data module).
- Pick and apply a learning algorithm. If you’re predicting something numeric such as price or age, choose a regression model. If you’re predicting a category such as gender or species, choose a classification model. You may want to vary the choice of model when you iterate.
- Train the model on the training set (Train Model module using the majority of the data from the split).
- Score the model on the testing set (Score Model module on the minority of the data from the split).
- Test the quality of the results (Evaluate Model module).
- Iterate to improve the model. You can add branches to your training experiment or create new training experiments. Copy and paste of the experiment is handy for this.
- Transform the best model into a Predictive Experiment.
- Deploy the Predictive Experiment as a web service.
Try the demos
 Microsoft
An example of a linear regression flow in Azure ML.
Microsoft offers a good set of introductory tutorials for Azure ML Studio. The first one (see figure above) covers steps 1 to 10 for a regression problem (automobile prices) and alludes to step 11. The second one covers steps 12 and 13.
 Microsoft
Finish off your model by tranforming it into a Predictive Experiment and publish it as a web service.
If you’d like to try a classification problem as well, another introductory tutorial walks you through a credit risk assessment model.
Try a model from the gallery

The Cortana Intelligence Gallery offers a selection of experiments, tutorials, custom modules, and solutions.
Now that you are familiar with how to step through Azure ML, it’s time to explore some models. If you navigate to the Cortana Intelligence Gallery, you can find a large selection of experiments, tutorials, custom modules, and solutions. For the purposes of this tutorial, let’s pick the experiment about data mining the 2016 presidential campaign finance data. (Use the link, as the experiment isn’t likely to be featured any more by the time you look at the gallery.)
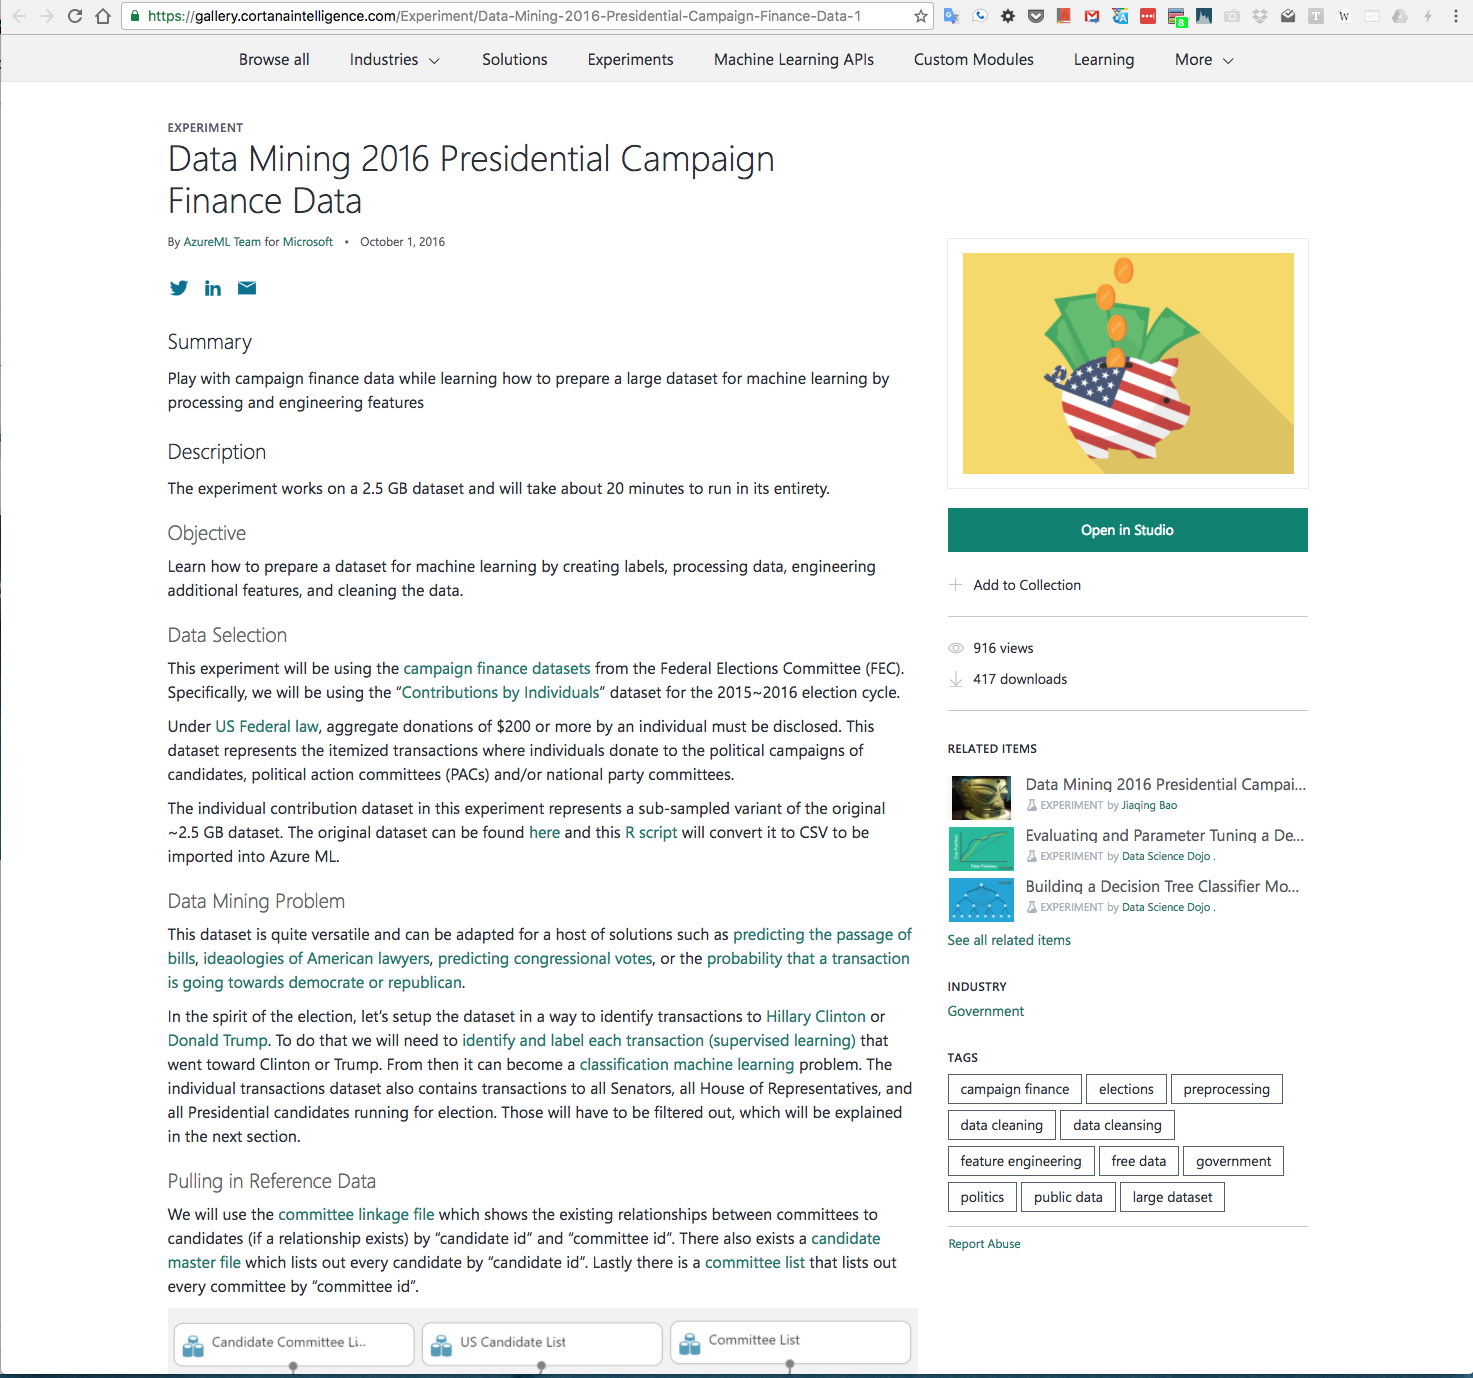
An Azure ML sample machine learning experiment using campaign finance data sets from the Federal Elections Committee.
This experiment uses the campaign finance data sets from the Federal Elections Committee, specifically the individual contributions data, the candidate list, the committee list, and the candidate-committee linkage file. If you right-click on the Open in Studio button you can bring up this experiment in your own ML Studio instance in a new tab.
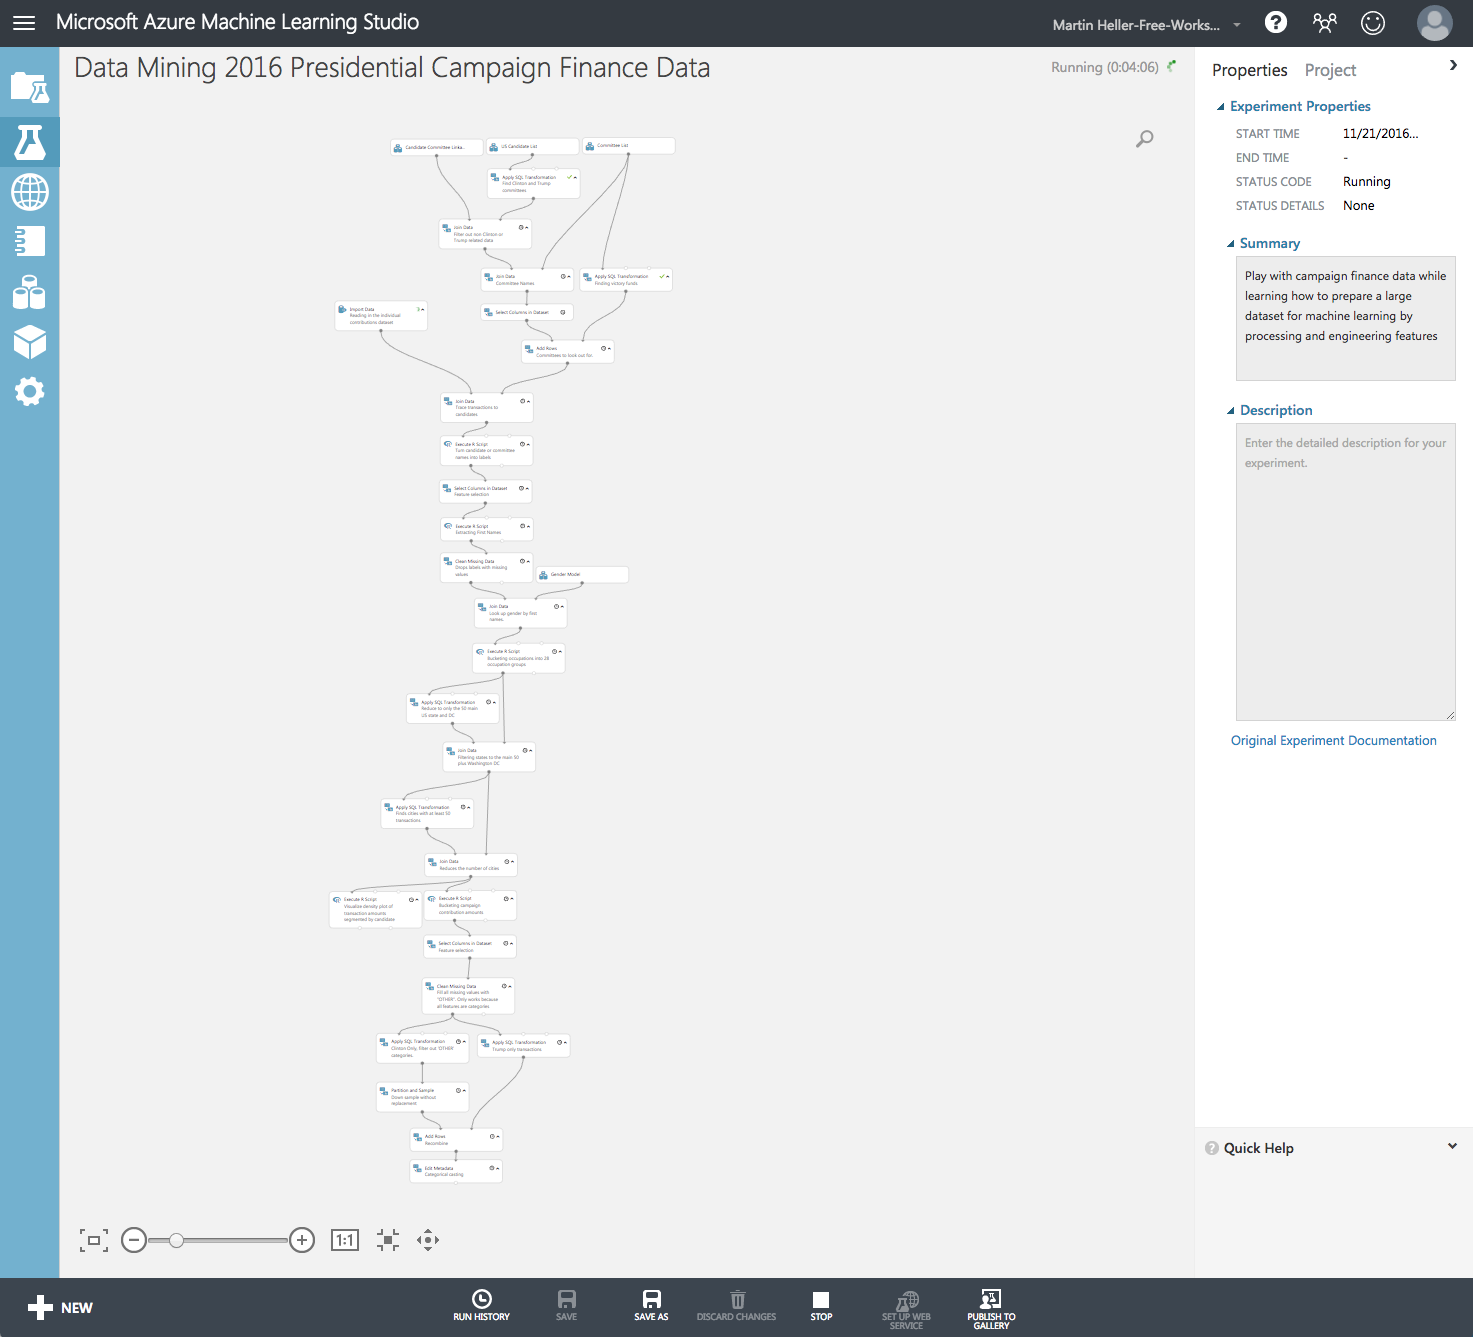
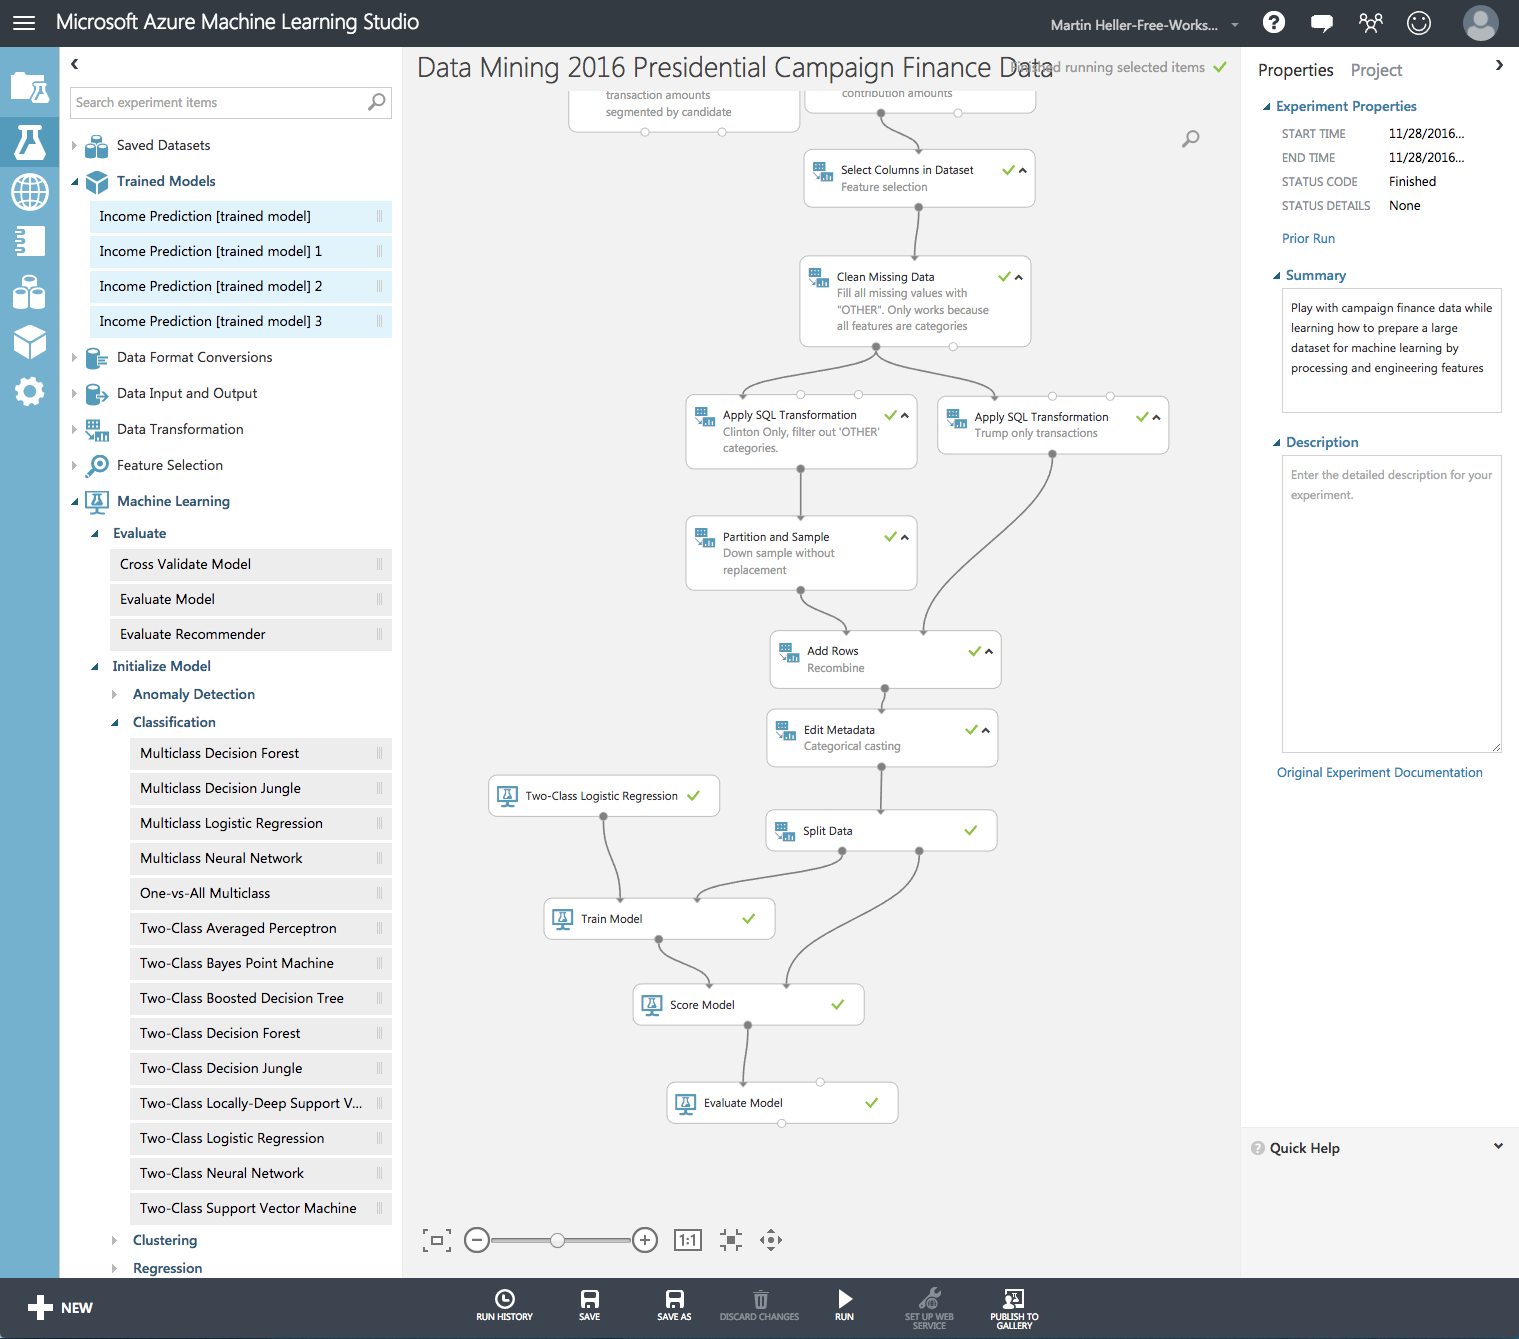
Model for data mining 2016 presidential campaign finance data.
This experiment took about 20 minutes to run in the Azure cloud the first time I ran it and about 25 minutes the second time; in the image above I was about 4 minutes into the process. Go ahead and run it, and read through the Microsoft discussion, then the write-up below while it cranks along—you can switch to another tab or program, but don’t close the Studio tab while it’s running. When it’s done running, save it. It’s entirely possible that an update may occur before you open it next, requiring you to rerun the model, but save it anyway.
As you read in the Azure ML team’s article, this experiment:
- Pulls in the data
- Filters out the non-Clinton, non-Trump contributions with SQL queries and a join data module
- Uses an R script to combine candidate and committee names
- Cleans rows that are missing data
- Predicts contributor gender from first names using a join data module
- Buckets occupations into 28 groups with an R script
- Filters to 50 states and Washington, D.C.
- Filters cities to ones that have at least 50 contributors
- Visualizes the density plot of contributions by amount for each candidate (see figure below)
- Buckets the contribution amounts into groups
- Eliminates unnecessary columns
- Cleans missing data
- Separates Clinton and Trump contributions and down-samples the Clinton contributions so that the data sets are the same size
- Recombines the Clinton and Trump contributions
- Turns all the columns into categories
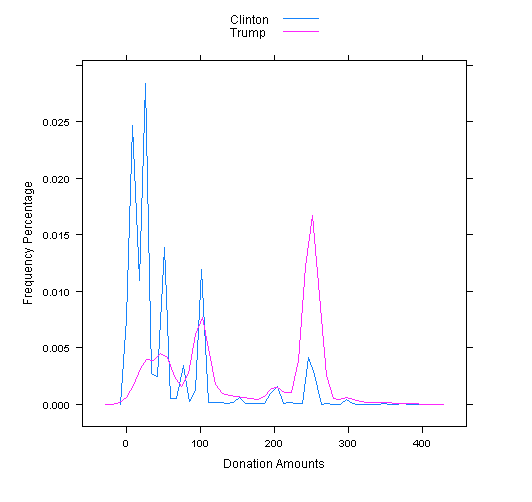
2016 campaign financial density chart.
An interesting question about this model is how it was developed. I haven’t asked Microsoft how this one evolved, but when I work on data analysis I take it one step at a time and iterate until that step is good enough to move on to the next step. First, find the data sets you need; then clean them up, join them, pick your variables, and transform the data as needed.
Add Classification Models
What 20-some minutes of processing got us was a clean categorical data set with half Clinton donations and half Trump donations, which corresponds to steps 1 to 5 in my summary of how to use Azure ML above. Now we need to pick at least one classification model to train to predict Clinton and Trump donors based on the other factors in the data set, and go through the next steps: Split the data, train it, score it, and evaluate the model. I trust you’ll play along at home.
The Machine Learning Algorithm Cheat Sheet is a good place to start when picking a model. Check out this article to understand how best to use the cheat sheet.
Since we’re working on a binary classification problem with a relatively small number of parameters, I’ll start my investigation with two-class logistic regression—a tried-and-true algorithm that trains quickly—and use the default parameters. Starting with this model doesn’t rule out using other models: The only way to find the best model is to try them all.

Two-class logistic regression model in Azure ML Studio.
Now I need to split the data. For a first cut, I’ll use 80 percent of the data for training and 20 percent for scoring.
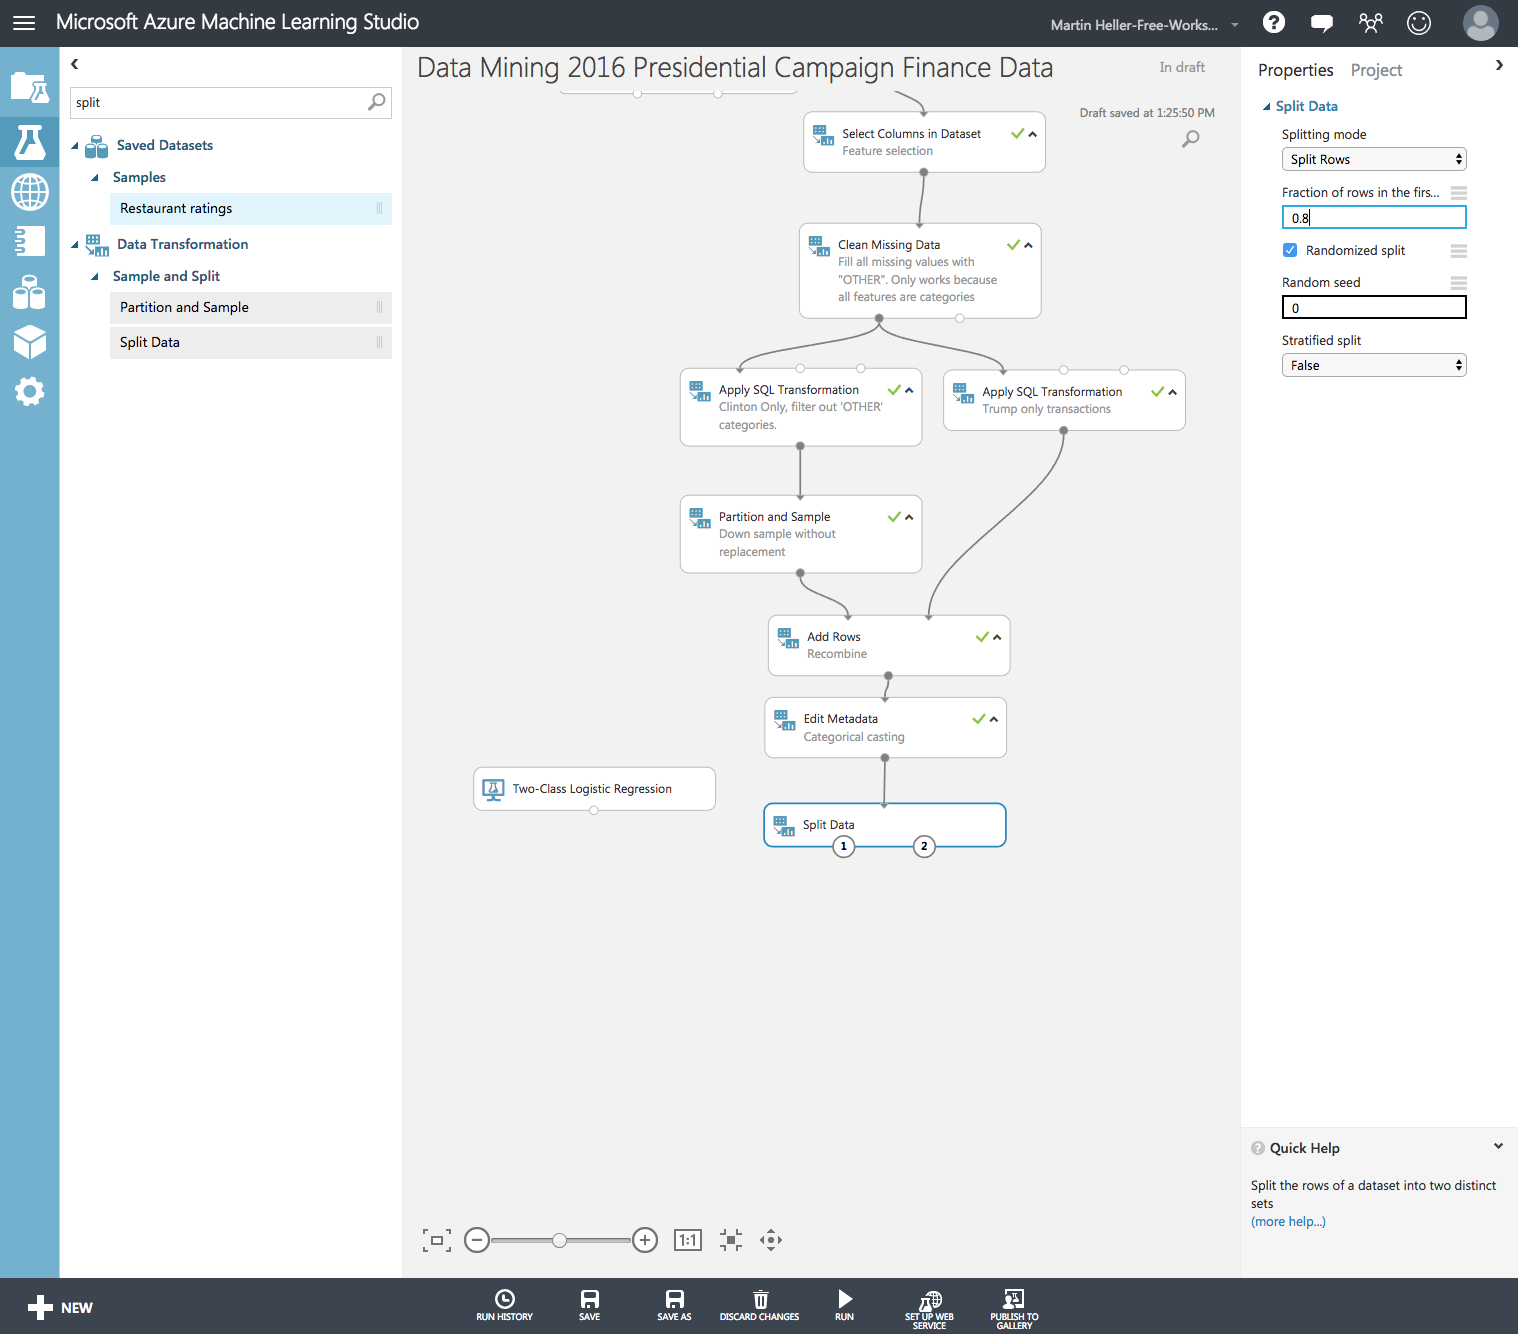
Splitting data for training in Azure ML Studio.
Next, I need to train, score, and evaluate the model. I’ll need to pick the affiliation column (Clinton or Trump) as the one predicted.
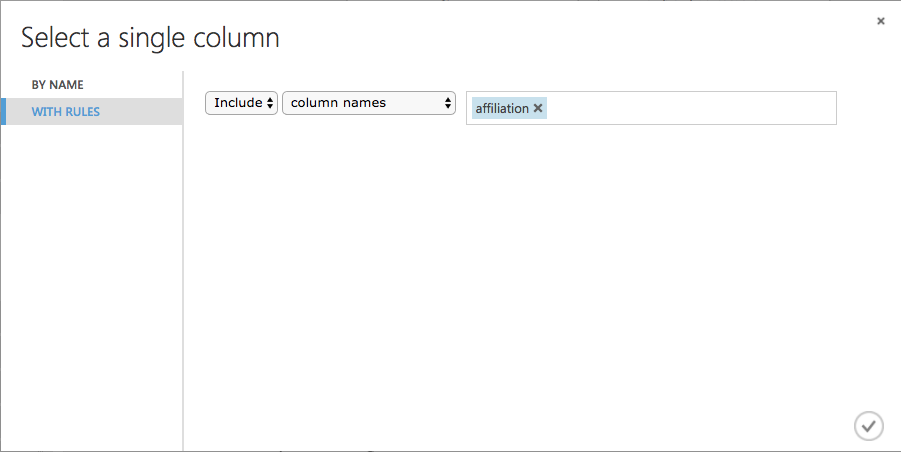
Selecting an affiliation column for training, scoring, and evaluating a campaign finance model in Azure ML.
The new module flow to evaluate the model looks like the following:
Module flow for evaluating a model in Azure ML.
Running the new modules is a matter of selecting them all and pressing Run/Run selected.
Finally, I can look at the evaluation:
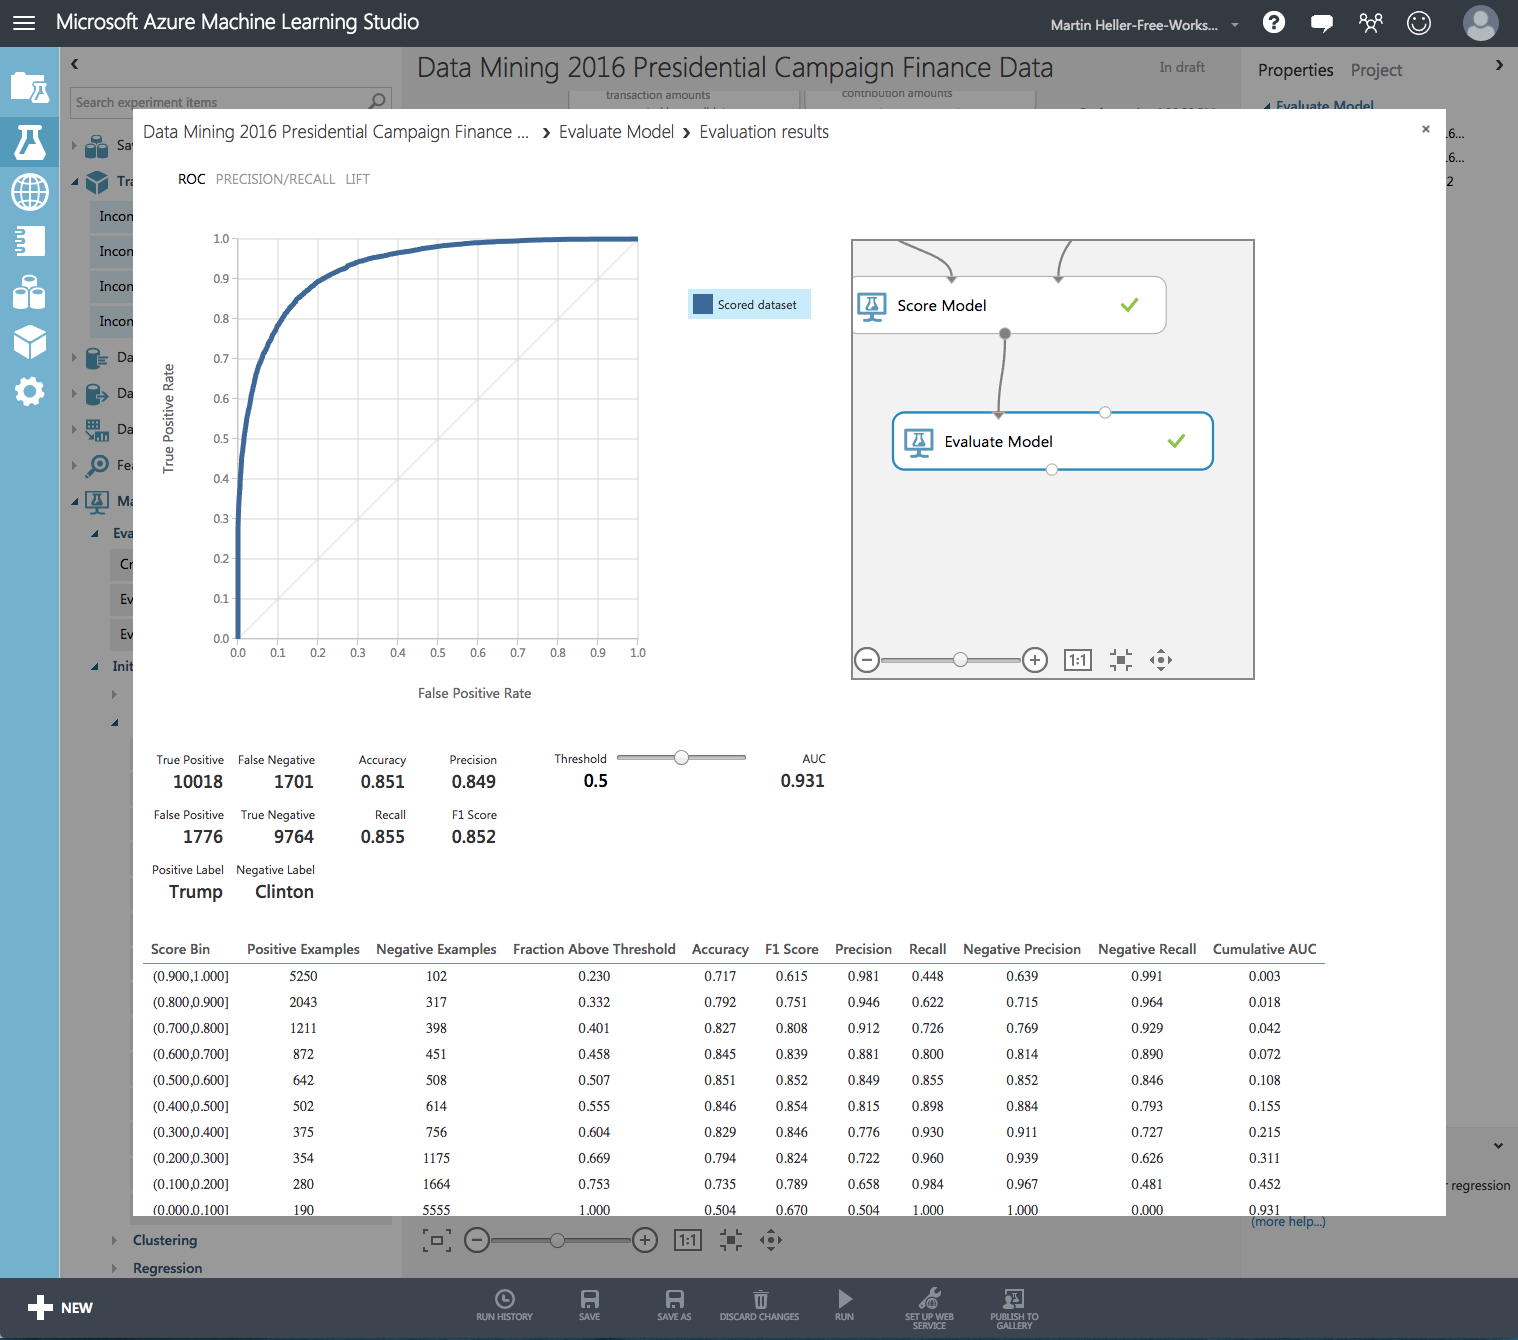
Evaluation results of sample campaign finance model in Azure ML.
This simplistic model got us an accuracy of 85.1 percent, a precision of 84.9 percent, and an AUC (the area under the Receiver Operating Curve) of 93.1 percent. I’ll bet you could do better with a little effort.
If you’d like to try different models such as decision forest, decision jungle, boosted decision tree, and neural network, and compare them to what I got from logistic regression, this experiment from the Cortana gallery shows you how. Basically, you’ll add new models along with training, scoring, and evaluation modules; connect them back to the Split Data module; then run the new parts of the diagram. You can use both input ports on the Evaluate Model module to compare the scores of two models side by side.
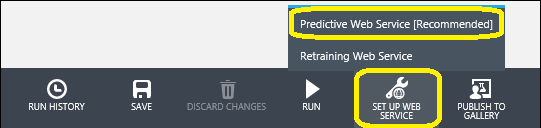
When you have found your best model, you can use it to set up a predictive web service. The basic steps are to press Run, then set up web service/create predictive experiment at the bottom of the Studio screen, but there are additional considerations discussed in the article on converting a training experiment to a predictive experiment.
Have fun!